University of Alabama’s interactive map shows thresholds for coastal nuisance flooding

A University of Alabama graduate student has created an interactive map that provides better estimates of sea-level rise rates and high-tide flooding thresholds along the entire United States coastline. (contributed)
As sea levels rise around the world, communities in coastal areas are more frequently seeing the impact of routine high-tide flooding. These incursions of sea water may weaken foundations and infrastructure, slow down traffic and curb business activities in affected areas.
University of Alabama graduate student Sadaf Mahmoudi, working under Dr. Hamed Moftakhari, trained machine-learning algorithms to learn the underlying features that contribute to sea-level rise and high-tide flooding. The study, published recently in Nature Communications, produced spatially distributed information through an interactive map showing estimated local sea-level rise rates and high-tide flooding thresholds along the entire United States coastline.
The tide is high
Tide gauges along the U.S. coastline, installed and monitored by the National Oceanic and Atmospheric Administration, provide sea-level rise information at sporadic intervals. According to Moftakhari, an associate professor in the University of Alabama College of Engineering, 75% of coastal communities in the U.S. do not have a tide gauge within a 10-kilometer radius. Often, the nearest gauge is 100 kilometers away.
This distance matters because sea-level rise rates and their associated flooding thresholds can vary significantly from place to place — Texas and Louisiana, for example, are experiencing sea-level rise rates at two to four times that of the global average. A tide gauge 100 kilometers away may not provide useful information for a given community.
Using the NOAA tide gauge data, Mahmoudi trained and validated machine-learning algorithms to learn the underlying features that contribute to these variations in sea-level rise. The result is a spatially distributed map that estimates sea-level rise at a finer resolution than has been available before.
High-water tipping point
Nuisance flooding is on the rise as the sea level rises. To provide information that can be useful to stakeholders and communities, the team next needed to develop a method of pinpointing a high-tide threshold, a point above which a community would begin to experience flooding impacts (i.e. traffic and business interruptions).
Ideally, there would be a flood-monitoring system and historical data for every coastal community to determine the water level at which flooding impacts start, but flood monitoring is available at even fewer points than tide gauges.
Mahmoudi and Moftakhari reached out to William Sweet, a researcher at NOAA, with their early work showing promise for a more accurate estimation of these thresholds. Their work built on the spatially distributed map of sea-rise levels and trained another set of machine-learning algorithms to provide a similar map of high-tide flooding thresholds.
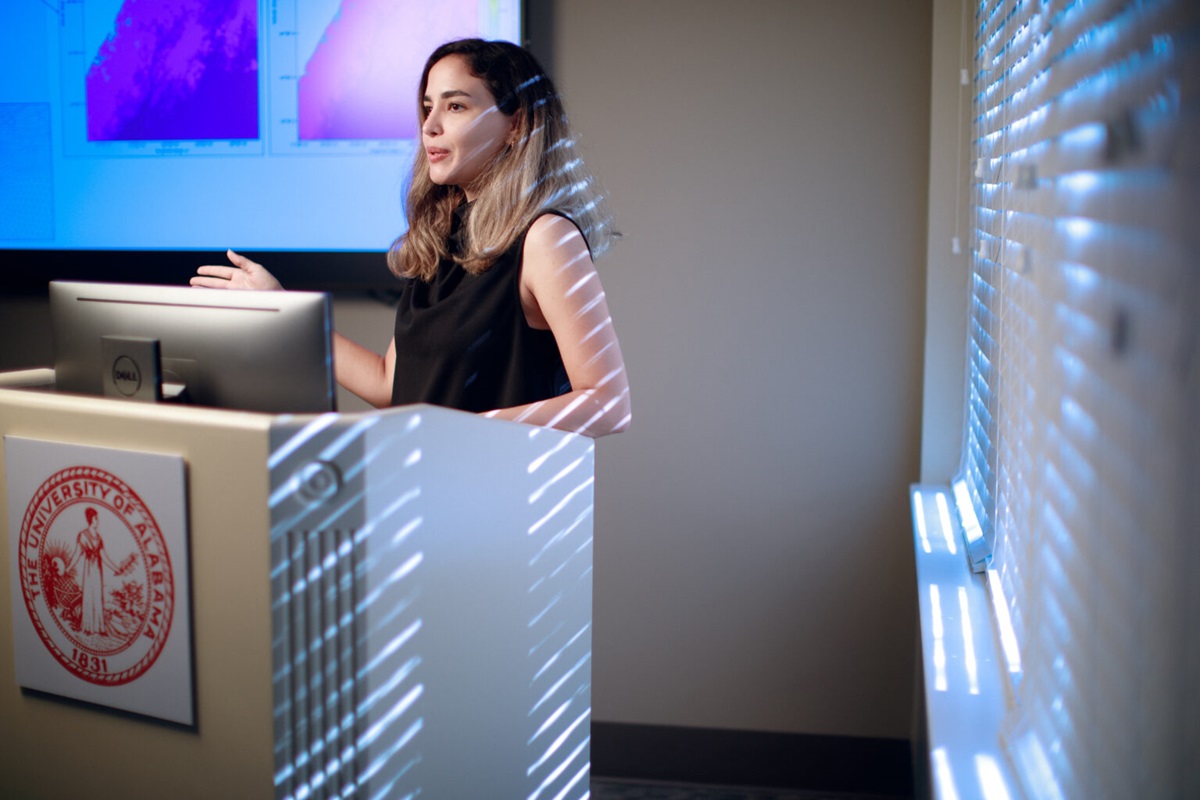
University of Alabama graduate student Sadaf Mahmoudi, pictured, working under her adviser, Dr. Hamed Moftakhari, trained and validated machine-learning algorithms to learn the underlying features that contribute to variations in sea-level rise along the coastline, then created an interactive map containing that information. (contributed)
Navigating troubled waters
Moftakhari, who is Mahmoudi’s graduate adviser, stressed the importance of involving NOAA in their research.
“We discussed it with them at every stage,” he said. “This project addresses very real need that is already out there. The federal and local government is worried about it, but we haven’t had a very good answer to it yet.”
The allocation of funding is one of the aspects of the research that has implications for every person living on the coasts. Most relief funding for flooding is based on disaster declarations, Moftakhari pointed out. These events have a clear beginning and ending.
But when state and local governments are considering funding for the future threat of sea-level rise, there are few standardized metrics to show the real costs associated with the slow accumulation of damages from nuisance flooding.
Mahmoudi’s maps show sea-level rise and high-tide flooding thresholds for a variety of climate scenarios.
“Being proactive is what everyone agrees on,” Moftakhari said. “Our analysis can help policymakers, homeowners and insurance companies come up with a standardized approach to document the risk and costs of high-tide flooding.”
This story originally appeared on the University of Alabama’s website.