Click here to view or print the entire monthly report compliments of the Alabama Center for Real Estate Corporate Cabinet. Join the Center mailing list here.
Sales: Alabama home sales totaling 3,050 units during January were an increase of 9 percent from the same month a year ago. Sales for the month continued to trend upward for the state, which bottomed out at 1,984 during January 2009. Sales are 23 percent above the January five-year sales average (2011-15) of 2,471 units. Two more resources to review: Quarterly Report and Annual Report.
Forecast: January sales were 5 percent, or 144 units above our monthly forecast. Alabama Center for Real Estate‘s (ACRE) year-to-date sales forecast through January projected 2,906 closed transactions while the actual sales were 3,050 units.
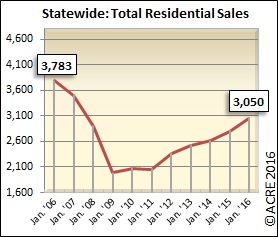
Home sales in Alabama rose 9 percent over the same period a year ago during January.
Supply: The statewide housing inventory during January was 28,488 units, a decrease of 9.1 percent from January 2015 and 27.4 percent below the January peak in 2008 (39,228 units). There was 9.3 months of housing supply in January (6 months is considered equilibrium), which represents a favorable drop of 16.5 percent from January 2015 (11.2 months). January inventory also decreased from December by 1.3 percent. This direction is consistent with historical data that indicates January inventory on average (2011-15) decreases from December by 0.7 percent.
Demand: January residential sales decreased 20 percent from the prior month. This direction is consistent with historical statewide data indicating that January sales on average (2011-15) increase from December by 18 percent. The average Days on Market until a listing sold was 154 days, down 4.5 percent from last year. Nationally, January sales were 11 percent above the same period last year. See more details of how Alabama compares to the broader US market
here. Pricing: The January median sales price increased 15.2 percent from the same period last year. During January, 76 percent, of local markets experienced price gains from January 2015. Keep in mind that this indicator can fluctuate from month to month due to sampling size of data and seasonal buying patterns. The January median sales price decreased 0.3 percent from the prior month. This direction is consistent with historical data averages (2011-15) reflecting that the January median sales price decreases 8 percent from December.
Seeking Balance: The metro markets in Alabama representing 70 percent of all sales continued to trend toward greater seller bargaining power with 8.2 months of supply. Outside the metro markets, Alabama’s mid-sized markets are reporting 10.2 months of supply, while rural areas are reporting 13.7 months of supply. With that said, there have been significant improvements from inventory peaks experienced during the recession. The supply of “quality” inventory in the past has impacted sales, according to some local professionals with boots on the ground.
Industry Perspective: “Housing affordability is being constrained because the pace of growth in real income has not kept up with gains in real home prices as demand has grown faster than supply,” said Doug Duncan, senior vice president and chief economist at Fannie Mae.
“On the bright side, consumers have been increasingly positive about their ability to get a mortgage, suggesting that credit tightness is not the main issue limiting housing market activity today, a feeling that we also see conveyed by lenders in our Mortgage Lender Sentiment Survey®. We expect further progress in the HPSI to be limited until income growth picks up or supply, particularly in lower-priced homes, expands more rapidly.”

The average home sold in Alabama during January sold for $156,979.

On average, homes sold in Alabama during January spent 154 days on the market.

Supply dropped 9 percent during the month of January statewide.

The media sales price for homes sold in Alabama during January was $133,267.

There was 9.3 months of supply on the market in Alabama during January.