Tuscaloosa home sales rose in February, inventory continues to fall

Tuscaloosa housing inventory has now declined 50 percent from the February peak (1,917 units) reached in 2008. (iStock)
Click here to view or print the entire monthly report compliments of the ACRE Corporate Cabinet.
Sales: According to the Tuscaloosa MLS, Tuscaloosa-area residential sales totaled 173 units during February, up 3.6 percent from the same month in 2016. Two more resources to review: Quarterly Report and Annual Report.
For all of the Tuscaloosa area’s housing data, click here.
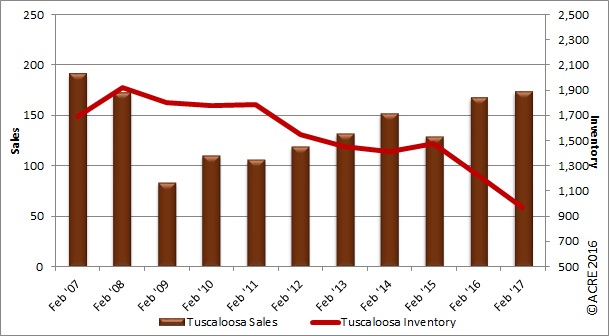
Home sales in Tuscaloosa during February rose 3.6 percent over last year.
Forecast: February results were two units or 1 percent above the Alabama Center for Real Estate’s monthly forecast. ACRE’s 2017 sales forecast through February projected 313 closed transactions, while the actual sales were 340 units.
Supply: Tuscaloosa February housing inventory totaled 966 units, a decrease of 21 percent from February 2016. February inventory dipped by 2 percent compared to January. Historical data indicate that February inventory on average (2012-16) increases from January by 4.3 percent. Inventory has now declined 50 percent from the February peak (1,917 units) reached in 2008.
Seeking balance: The inventory-to-sales ratio declined 24 percent year-over-year during February to 5.6 months. Restated, at the February sales pace, it would take 5.6 months to absorb the current inventory for sale. The market equilibrium (balance between supply and demand on a non-seasonally adjusted basis) is considered to be approximately 6 months during February.
Demand: February residential sales were 3.6 percent above the prior month. This is consistent with seasonal buying patterns and historical data indicating that February sales on average (2012-16) increase from January by 24.6 percent. Existing single-family home sales accounted for 83 percent of total sales (up from 78 percent in February 2016), while 9 percent were new home sales (down from 13 percent in 2016) and 8 percent were condo sales (down from 9 percent).
Pricing: The Tuscaloosa median sales price in February was $153,500, a decrease of 1 percent compared to February 2016. The median sales price was up 2.4 percent from January’s price. Historical data (2012-16) indicate that the median sales price in February typically decreases from January by 2.5 percent. It should be noted that differing sample size (number of residential sales of comparative months) can contribute to statistical volatility, including pricing. Consult with a real estate professional to discuss pricing, as it will vary from neighborhood to neighborhood.
Industry perspective: “We expect the housing expansion to continue, albeit at a more moderate pace than last year given continued pressure on affordability,” said Fannie Mae Chief Economist Doug Duncan. “Depressed inventory, particularly in the more affordable segments, will likely constrain sales and push home price gains that outpace income growth. A faster pace of monetary tightening, unless accompanied by a stronger increase in household income, also poses downside risk to housing.”
Click here to generate more graphs from the Tuscaloosa February Housing Report, including Total Sales, Average Sales Price, Days on the Market, Total Inventory and Months of Supply.
The Tuscaloosa Residential Monthly Report is developed in conjunction with the Tuscaloosa Association of Realtors to better serve West Alabama consumers.