Cullman December home sales up 35 percent from 2016
The Cullman area median home sales price in December was $159,900, an increase of 30 percent from December 2016. (iStock)
Click here to view or print the entire monthly report compliments of the ACRE Corporate Cabinet.
Sales: According to the Cullman MLS, Cullman County area residential sales totaled 77 units during December, a 35.1 percent increase from the same month a year earlier. Sales for 2017 through December were up 15 percent from 2016. Two more resources to review: Quarterly Report and Annual Report.
For all of Cullman’s real estate data, click here.
Demand: December residential sales increased 10 percent from the prior month. Historical data indicates that December residential sales on average (’12-’16) decreased from the month of November by 9.2 percent. Homes selling in the Cullman area in December averaged 120 days on the market, compared with 111 days on the market during December 2016.
Forecast: December sales were 26 units or 51 percent above the Alabama Center for Real Estate’s monthly forecast. ACRE’s 2017 sales forecast through December projected 798 closed transactions, while the actual sales were 852.
Supply: Cullman area housing inventory totaled 501 units, representing a 7.5 percent increase from December 2016. The inventory-to-sales ratio in December was 6.5 months of housing supply. The market equilibrium (balance between supply and demand) is approximately 6 months.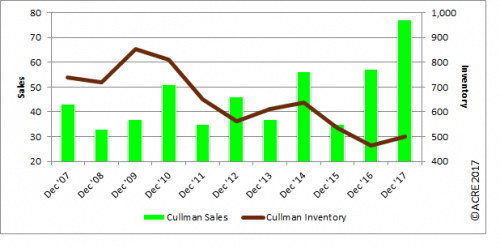
Pricing: The Cullman area median sales price in December was $159,900, an increase of 30 percent from the December 2016 median sales price of $123,000. The median sales price was 7.9 percent above the prior month. Pricing can fluctuate from month to month as the sample size of data (closed transactions) is subject to seasonal buying patterns. ACRE recommends consulting a local real estate professional.
Industry perspective: “(Last year) ushered in with an outlook of uncertainty on the heels of the 2016 national elections, but 2017 went out with an exclamation punctuation mark of growth,” said KC Conway, director of research and corporate engagement at the Alabama Center for Real Estate (ACRE). Conway said 2017 “was the year we have waited a decade for since the onset of the 2006-2007 housing crisis. U.S. GDP turned in back-to-back quarters of more than 3 percent growth in Quarter 2 and Quarter 3; and 2017 will be the first year in a decade that the U.S. turned in an annual GDP growth rate north of 2 percent. It was just 1.7 percent in 2016. (The new year) will see 2.5 to 3 percent GDP growth.
“Employment growth is a good-news story as well. The ADP National Employment Report is this economist’s go-to monthly jobs report as it is based on rich primary data – not a survey, as in the case of BLS jobs report. The January ADP report revealed more than 250,000 jobs created in the month of December (compared with 148,000 in the BLS year-end jobs report). ADP job growth for the trailing three months (more than 224,000 jobs), six months (more than 199,000 jobs), and 12 months (more than 212,000 jobs) were all at or above 200,000 jobs per month. This trend should continue through 2018.
“Heading into 2018, the more important questions to answer for Alabama Realtors are:
- What do the real estate metrics look like?
- Will home builders finally be confident enough to start more inventory?
- Will the Fed ruin the good times with more rate hikes in 2018?
“With respect to the real estate market conditions and home-builder confidence, the National Association of Home Builders (NAHB) Housing Market Index (HMI) is your best barometer of things to come. The HMI is a monthly survey of NAHB members to take their pulse on the single-family housing market and rate conditions for the sale of new homes over the coming six months. In December 2017, the HMI registered 74 — the second-best reading since 1985 and best since December 1998. A reading above 50 reflects growth. The December 2017 reading of 74 compares to a record low of just 8 in January 2010. We have come a long way since 2009-2010.
“With respect to home-building activity in Alabama during 2018, some perspective on 2017 is fruitful. In 2017, Alabama issued 13,200 permits in the January to November period – of which 11,200 were for single-family residences and 2,000 multifamily units. Breaking down the Alabama permit activity, Huntsville has overtaken Birmingham for the most total housing permits with 2,804 (2,422 single family versus 382 multifamily). The top five metropolitan statistical areas for housing permit activity during 2017 through November were:
- Huntsville with 2,804 total permits.
- Birmingham with 2,746 permits.
- Daphne-Foley with 1,699 total permits.
- Auburn with 1,292 total housing permits.
- Tuscaloosa with 976 total new permits.
“Finally, will the Fed ruin the good times with too many rate hikes? In short, the answer is no. However, the Fed is worth watching in 2018 as it is a new cast of characters led by a new chairman (Chairman Jerome Powell has yet to be confirmed by the Senate but is expected to take over in February or March from existing Chair Janet Yellen). The Fed is not likely to depart from rate hikes in 2018 (expect three, maybe four, starting in March due to higher GDP and tighter labor markets). Communicate now with your prospective spring home buyers as the 10-Year Treasury is rising. It is already threatening a 2.6 percent level. Thirty-year mortgage rates will climb above 4 percent in 2018. New home builders can manage rate increases by curtailing amenities in the new home to buy-down the mortgage rate to 4 percent or below. New home activity will not be impacted, but existing home listings will have a disadvantage unless sellers are willing to contribute toward points to also buy down the rate. Dust off your playbook as to how this works so you don’t lose a sale in 2018. Home-price appreciation is strong and ran above 6 percent in 2017. It will remain strong (above 5 percent) in 2018 despite signs that more inventory is going to be put in the ground during the spring 2018 months.”
Click here to generate more graphs from the Cullman December Housing Report, including Total Sales, Average Sales Price, Days on the Market, Total Inventory and Months of Supply.
The Cullman County Residential Monthly Report is developed in conjunction with the Cullman Association of Realtors to better serve Cullman-area consumers.