Mobile March home sales up from February, down from 2017

The Mobile-area median home sales price in March was $138,915, an increase of 1.4 percent from this time last year. (iStock)
Click here to view or print the entire monthly report compliments of the ACRE Corporate Cabinet.
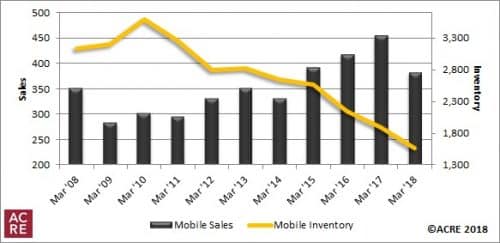
Sales: According to the Mobile Area Association of Realtors, Mobile-area residential sales totaled 381 units during March, a decrease of 16.1 percent from the same month in 2017, when there were 454 residential sales. Current results are 2 percent below the five-year monthly average of 389 closed transactions. Two more resources to review: Quarterly Report and Annual Report.
Forecast: March sales in the Mobile area were 42 units or 10 percent below the Alabama Center for Real Estate’s (ACRE) monthly forecast. ACRE projected 423 total sales during March, while there were 381 actual sales during the month. ACRE’s year-to-date forecast projected 1,029 sales in the area through March, while there were 930 actual year-to-date sales.
Supply: The Mobile-area housing inventory in March was 1,558 units, a decrease of 17.7 percent from March 2017. Inventory has declined 56.6 percent from the 10-year March peak of 3,593 units reached in 2010. The five-year average for the area during March is 2,416 listings.
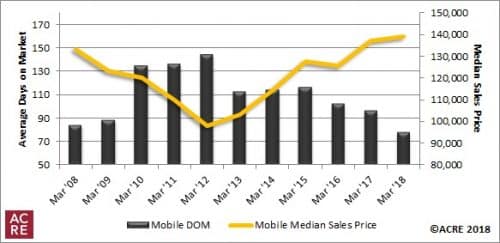
Demand: March sales increased 24.5 percent from February. This is consistent with historical data indicating that March sales on average (2013-2017) increase 30.7 percent from February. Homes selling in the area during March averaged 78 days on the market, a decrease of 18 days from the days-on-market average from the same month in 2017. Homes sold 30 days faster than the five-year March average of 108 days on the market.
Seeking balance: The inventory of homes for sale divided by the current monthly sales volume equals the number of months of housing supply. Most real estate professionals consider the market to be in balance at approximately 6 months of housing supply. The Mobile area currently has 4.1 months of housing supply, down from 4.2 months during the same period in 2017. The five-year average for the month of March is 6.4 months of housing supply.
Pricing: The Mobile-area median sales price in March was $138,915, an increase of 1.4 percent from this time last year. The March median sales price decreased 4.2 percent from the previous month. This drop in median price from the previous month contrasts with historical data, which indicate that March median sales prices on average (2013-2017) increase 0.2 percent from February. Pricing can fluctuate from month to month as the sample size of data is subject to seasonal buying patterns. ACRE highly recommends consulting with a local real estate professional to discuss prices, which can vary from neighborhood to neighborhood.
Industry perspective: Interest rates are likely to increase throughout 2018. The Federal Reserve’s Federal Open Market Committee (FOMC) met on March 21 and approved a quarter-point rate hike. As of April 5, the 10-Year Treasury stood at 2.83 percent, down slightly from 2.88 percent one month ago. Although daily yield curve rates have decreased slightly in the past month, many analysts are projecting that the 10-year Treasury will pass 3 percent in the months to come. According to Wells Fargo, the current interest rate on a 30-year fixed-rate mortgage is 4.58 percent (annual percentage rate).
As the overall economy continues to expand, it is not surprising to see growth in Alabama’s residential new construction market. February sales of newly constructed homes grew 22 percent month-over-month and 14 percent year-over-year. Statewide*, there were 507 new construction sales in February, up from 416 total sales in January and up from 445 total sales in February 2017. Year-to-date, new construction sales are up 6 percent from 2017.
 February new construction sales in select Alabama markets
- Baldwin County – 100
- Birmingham Metro Area – 125
- Huntsville Metro Area – 112
- Lee County – 36
- Mobile Metro Area – 17
- Montgomery Metro Area – 35
- Tuscaloosa County – 15
New construction building permits and housing starts data are indicators of larger economic conditions. Generally speaking, the housing market is one of the first sectors to expand or contract during times of growth or decline. According to the U.S. Census Bureau, 1,225 building permits for new construction were issued in Alabama during February. Building permits increased 1.1 percent from January, when 1,212 permits were issued, and increased 10.1 percent from February 2017, when 1,113 permits were issued. ACRE projected 1,219 housing starts in Alabama during February. Housing starts decreased 2.9 percent from January (1,256) and increased 13 percent from February 2017 (1,079). Year-over-year increases in both building permits and projected housing starts are encouraging news, as they hint toward continued overall economic growth during the second quarter of 2018.
*ACRE receives new construction sales data from the following counties/areas: Baldwin County, Birmingham Metro Area, Calhoun County, Huntsville Metro Area, Lee County, Mobile Metro Area, Montgomery Metro Area, Tuscaloosa County and the Wiregrass Region. Combined, these counties/areas represent +/- 70 percent of Alabama’s total population.
The Mobile Area Residential Monthly Report is developed in conjunction with the Mobile Area Association of Realtors to better serve Gulf Coast consumers.