Tuscaloosa home sales wrap up best first quarter since 2007

Home sales rose 10 percent in the first quarter of 2017 over the same period of 2016. (iStock)
Click here to read the full Tuscaloosa First Quarter Housing Report from the Alabama Center for Real Estate.
Tuscaloosa continued to be one of Alabama’s healthiest housing markets during the first quarter of 2017.
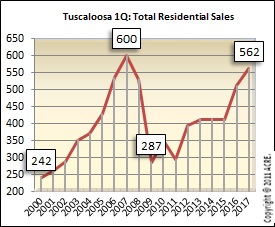
Home sales topped out at 562 in Tuscaloosa during the first quarter.
While supply continues to fall in the area, as it has in markets nationwide, home sales rose 10 percent over the first quarter of 2016.
There were 562 homes sold during the first three months of the year, 50 more than the same period a year ago. This is the best first-quarter performance since 600 homes were sold in 2007.
One of the major statistics to watch in Tuscaloosa moving forward is the dwindling supply of homes listed for sale in the area. There were 964 homes listed for sale at any given time during the first quarter, 20 percent fewer than the first quarter a year ago (1,200 homes).
First-quarter inventory in Tuscaloosa peaked in 2008 at 1,901 homes on the market. Leading up to the recession, homes were being built at a fast rate to keep up with demand. While demand is high in the area today, inventory has not been able to keep up, which puts upward pressure on prices and first-time homebuyers.
The median sales price in Tuscaloosa rose slightly in the first quarter to $157,654. This represents an all-time high in first-quarter home prices for Tuscaloosa.
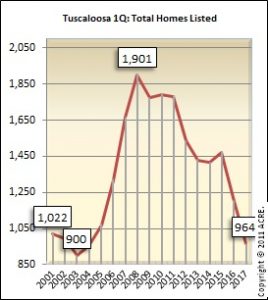
Inventory fell below 1,000 during the first quarter of 2017 in Tuscaloosa.
That, coupled with other factors like a rising mortgage rate environment, could cause affordability issues for some home shoppers moving forward.
Currently, homes are staying on the market around 81 days in Tuscaloosa, selling 19 percent faster than a year ago.
The inventory-to-sales ratio stood at 5.2 during the first quarter. Restated, at the first-quarter pace, it would take 5.2 months to absorb the current supply.
Click here to generate graphs from the Tuscaloosa March Housing Report, including Total Sales, Average Sales Price, Days on the Market, Total Inventory and Months of Supply.
The Tuscaloosa Residential Quarterly Report is developed in conjunction with the Tuscaloosa Association of Realtors to better serve West Alabama consumers.