Tuscaloosa home sales up 15 percent in October from same period last year

The Tuscaloosa median home sales price in August was $171,640, an increase of 4.8 percent compared to October 2016. (iStock)
Click here to view or print the entire monthly report compliments of the ACRE Corporate Cabinet.
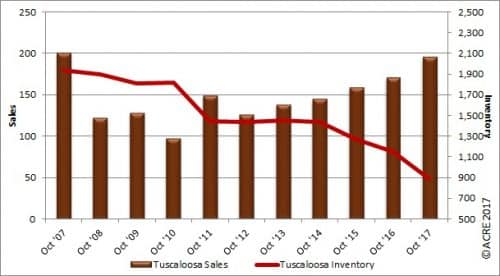
Sales: According to the Tuscaloosa MLS, Tuscaloosa-area residential sales totaled 195 units during October, up 14.7 percent from 170 homes sold during October 2016. Year to date, sales are up 11.9 percent from the same period in 2016. Two more resources to review: Quarterly Report and Annual Report.
For all of the Tuscaloosa area’s housing data, click here.
Forecast: October results were eight units or 4.3 percent below the Alabama Center for Real Estate’s monthly forecast. ACRE’s 2017 sales forecast through October projected 2,190 closed transactions, while the actual sales were 2,210 units.
Supply: Tuscaloosa’s October housing inventory totaled 888 units, a decrease of 23 percent from October 2016. October inventory decreased by 3.4 percent compared to September. Inventory has now declined 54.2 percent from the October peak (1,937 units) reached in 2007.
Seeking balance: The inventory-to-sales ratio in October declined 32.9 percent year-over-year to 4.6 months. Restated, at the October sales pace, it would take 4.6 months to absorb the current inventory for sale. The market equilibrium (balance between supply and demand on a non-seasonally adjusted basis) is considered to be approximately 6 months.
Demand: October residential sales were 2.6 percent above the prior month.
Pricing: The Tuscaloosa median sales price in August was $171,640, an increase of 4.8 percent compared to October 2016. The median sales price was up 2.7 percent from September’s price. Historical data (2012-16) indicate that the median sales price in October typically increases from September by 1.7 percent. It should be noted that differing sample size (number of residential sales of comparative months) can contribute to statistical volatility, including pricing. Consult with a real estate professional to discuss pricing, as it will vary from neighborhood to neighborhood.
Click here to generate more graphs from the Tuscaloosa October Housing Report, including Total Sales, Average Sales Price, Days on the Market, Total Inventory and Months of Supply.
The Tuscaloosa Residential Monthly Report is developed in conjunction with the Tuscaloosa Association of Realtors to better serve West Alabama consumers.