February home sales in Lee County rise sharply from one year ago

The Lee County median home sales price during February was $215,000, up 10.2 percent from a year ago. (iStock)
Click here to view or print the entire monthly report compliments of the ACRE Corporate Cabinet.
Sales: According to the Lee County Association of Realtors Multiple Listing Service, Lee County residential sales totaled 149 units during February, an increase of 35 units or 30.7 percent from the same month in 2017. Existing single-family homes accounted for 55 percent of all residential sales for the month, while condos were 20 percent and new construction represented the remaining 25 percent. Two more resources to review: Quarterly Report and Annual Report.
Click here for all of the Alabama Center for Real Estate’s Lee County residential data.
Forecast: February sales in Lee County were 28 units or 23.1 percent above ACRE’s monthly forecast. ACRE projected 121 closed transactions for the month, while there were 149 actual closed sales. ACRE forecasts a total of 2,035 sales for the area during 2018. There were 1,867 actual sales in Lee County during 2017.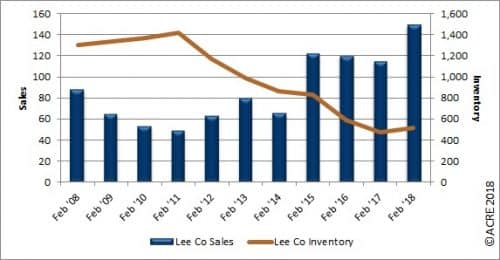
Supply: The Lee County housing inventory in February was 516 units, an increase of 8.9 percent from February 2017 and a 63.6 percent decrease from the 10-year February inventory peak in 2011 (1,417 units). February inventory in Lee County increased 6.4 percent from the previous month. This is consistent with historical data from 2013-17 indicating that February inventory on average increases from January by 13.8 percent.
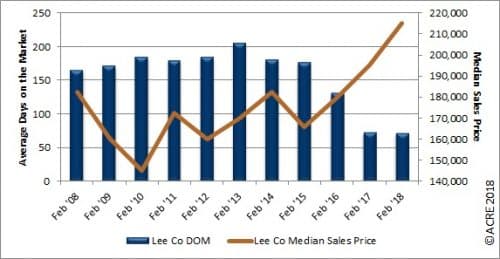
Demand: February residential sales increased 30.7 percent from January. This direction is consistent with historical data indicating that February sales on average (2013-17) increase 11.4 percent from January. Homes selling in February averaged 71 days on the market, a decrease of 1.4 percent from last year. The five-year days-on-the-market (DOM) average for Lee County during February is 153 days.
Seeking balance: The inventory for sale divided by the current monthly sales volume equals the number of months of supply. The market is considered to be in balance at approximately 6 months. The inventory-to-sales ratio in February was 3.5 months of housing supply, down from 4.3 months of supply in January and down from 4.2 months of supply one year ago.
Pricing: The Lee County median sales price during February was $215,000, up 10.2 percent from one year ago. The February median sales price was down 7.3 percent from the previous month. This is consistent with historical data (2013-17) indicating that the February median sales price on average decreases from the January price by 9.6 percent. Pricing can fluctuate from month to month as the sample size of data (closed transactions) is subject to seasonal buying patterns. ACRE recommends contacting a local real estate professional to discuss the latest pricing trends.
Industry perspective: The 10-year treasury is a crucial indicator of economic expansion. As of March 1, 2018, the 10-year treasury stood at 2.88 percent, a slight increase from last month’s rate of 2.86 percent. Mortgage rates also experienced a slight increase recently as the current rate on a 30-year fixed-rate mortgage is 4.57 percent, up from 4.38 percent one month ago. As the economy continues to strengthen, people will have more money in their pockets with the intent to spend. This increase in spending will most likely create higher stock prices and lower bond prices. With this increase of confidence in the market, mortgage interest rates can be expected to increase.
The National Association of Home Builders (NAHB) produces economic analyses of the home-building industry based on government data. The Housing Market Index (HMI) depicts market conditions for the sale of new homes. The HMI ranges from 0 to 100; a rate greater than 50 represents good sales conditions.
The HMI in the South has stayed relatively steady in the past few months with a score of 73. However, the HMI is lower in some regions of the United States, such as the Northeast, which has a rate of 56. The West has a higher HMI of 77, and a better market for good housing conditions.
The Federal Housing Finance Agency uses the House Price Index (HPI) to measure the average price changes in repeat sales or refinancing on the same properties. The FHFA’s national HPI was up 6.7 percent from the previous year compared to Alabama, which has increased from the previous year by 5.6 percent. The HPI rose in all 49 states except for Mississippi.
Compared to the national housing market conditions, Alabama’s real estate market has been showing improvement. Although total residential sales in Alabama decreased 2.3 percent from January 2017, the statewide median sales price increased 2.3 percent from January 2017. Statewide, homes in Alabama are selling much more quickly than in recent years as the average days on the market decreased 19.6 percent from one year ago.
Click here to generate more graphs from the Lee County February Housing Report, including Total Sales, Average Sales Price, Days on the Market, Total Inventory and Months of Supply.
The Lee County Residential Monthly Report is developed in conjunction with the Lee County Association of Realtors.