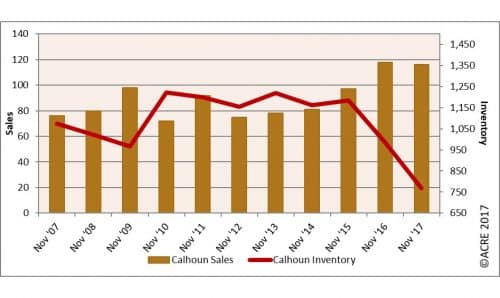
Calhoun County home sales through November up 7.6 percent from 2016
The Calhoun County median home sales price in November was $125,250, an increase of 5.7 percent from November 2016. (iStock)
Click here to view or print the entire monthly report compliments of the ACRE Corporate Cabinet.
Sales: Calhoun County residential sales totaled 116 units during November, down 1.7 percent from the prior year. Year-to-date sales are up 7.6 percent from 2016. Two more resources to review: Quarterly Report and Annual Report.
For all of Calhoun County’s area real estate data, click here.
Forecast: November sales were 2 units or 1.75 percent above the Alabama Center for Real Estate’s (ACRE) monthly forecast. The 2017 sales forecast through November projected 1,360 closed transactions, while the actual sales were 1,515 units.
Supply: Calhoun County area housing inventory totaled 768 units, a decrease of 22.1 percent from November 2016. Inventory decreased 4.6 percent from the prior month. At the November sales pace, it would take 6 months to absorb the current inventory for sale. The market equilibrium (balance between supply and demand) is considered to be approximately 6 months.
Demand: November residential sales decreased 12.1 percent from October. Historical data from Calhoun County indicate that November sales on average (2012-16) decrease from October by 8 percent. The average days on the market until a listing sold was 124 days, down 19.2 percent from the previous November.
Pricing: The Calhoun County median sales price in November was $125,250, an increase of 5.7 percent from November 2016’s median sales price ($118,450). Pricing can fluctuate from month to month as the sample size of data (closed transactions) is subject to seasonal buying patterns. ACRE recommends consulting with a local real estate professional to discuss prices, as they will vary from neighborhood to neighborhood.
Industry perspective: “The economy and real estate markets continue to show they are resilient. Regardless of the economic metric — GDP, monthly jobs or home prices — the dashboard registers an ‘all-systems-go’ economy,” said KC Conway, director of research and corporate engagement at the Alabama Center for Real Estate. “GDP started the year off with its best Q1 reading in several years and followed it up with above 3 percent readings for Q2 and Q3. (This year) will be the first year since the financial crisis that the economy registered an annual GDP greater than 2 percent. It was just plus 1.6 percent for 2016.
“Job growth is healthy as well. The first week of December the market received solid monthly jobs reports from both ADP (which measures private industry job formation) and the BLS (the government’s monthly jobs report produced by the Bureau of Labor Statistics). ADP reported a healthy new 190,000 private-sector jobs for November and a monthly average of 210,000 jobs over the prior 12 months. The BLS reported November jobs at a higher-than-expected level of 228,000 jobs – and its year-to-date monthly average is 174,000. Unemployment remains low at 4.1 percent, and inflation was just reported on December 13th at 1.7 percent for the “core rate” (which excludes the more volatile food and energy components) and 2.2 percent overall annualized due to higher energy prices.
“The Federal Reserve is taking note of the expanding economy and followed up its prior two rate hikes earlier in 2017 with a 0.25 percent rate increase at its December 13th meeting. Housing conditions remain conducive to growth in new supply and more transaction activity. Single-family home inventories are below demand levels across the nation, Southeast and most Alabama markets. The national rate of appreciation is running above 6 percent on the heels of 5-plus percent in 2016. This is leading builders and lenders to be more receptive to adding inventory. New housing starts and permits will likely end 2017 at or above the 1.3 million units level, split 30 percent multifamily and 70 percent single-family. The outlook heading into 2018 is the best we have seen in a decade.”
Click here to generate more graphs from Calhoun County’s November Housing Report, including Total Sales, Average Sales Price, Days on the Market, Total Inventory and Months of Supply.
The Calhoun County Residential Monthly Report is developed in conjunction with the Calhoun County Area Board of Realtors to better serve Anniston-area consumers.